Hero Background
Industrial IoT● Available

OEE Monitoring

Real-time visibility into machine performance. Maximize productivity, minimize downtime, and drive data-driven manufacturing excellence with AI-powered insights.

Understanding OEE

The OEE Formula

Overall Equipment Effectiveness measures manufacturing productivity across three critical dimensions.

⏱️
Availability
Machine uptime / Total scheduled time
Performance
Actual cycle time / Theoretical cycle time
Quality
Good parts produced / Total parts produced

OEE is calculated as:

OEE = Availability × Performance × Quality

A score of 85%+ represents world-class manufacturing performance
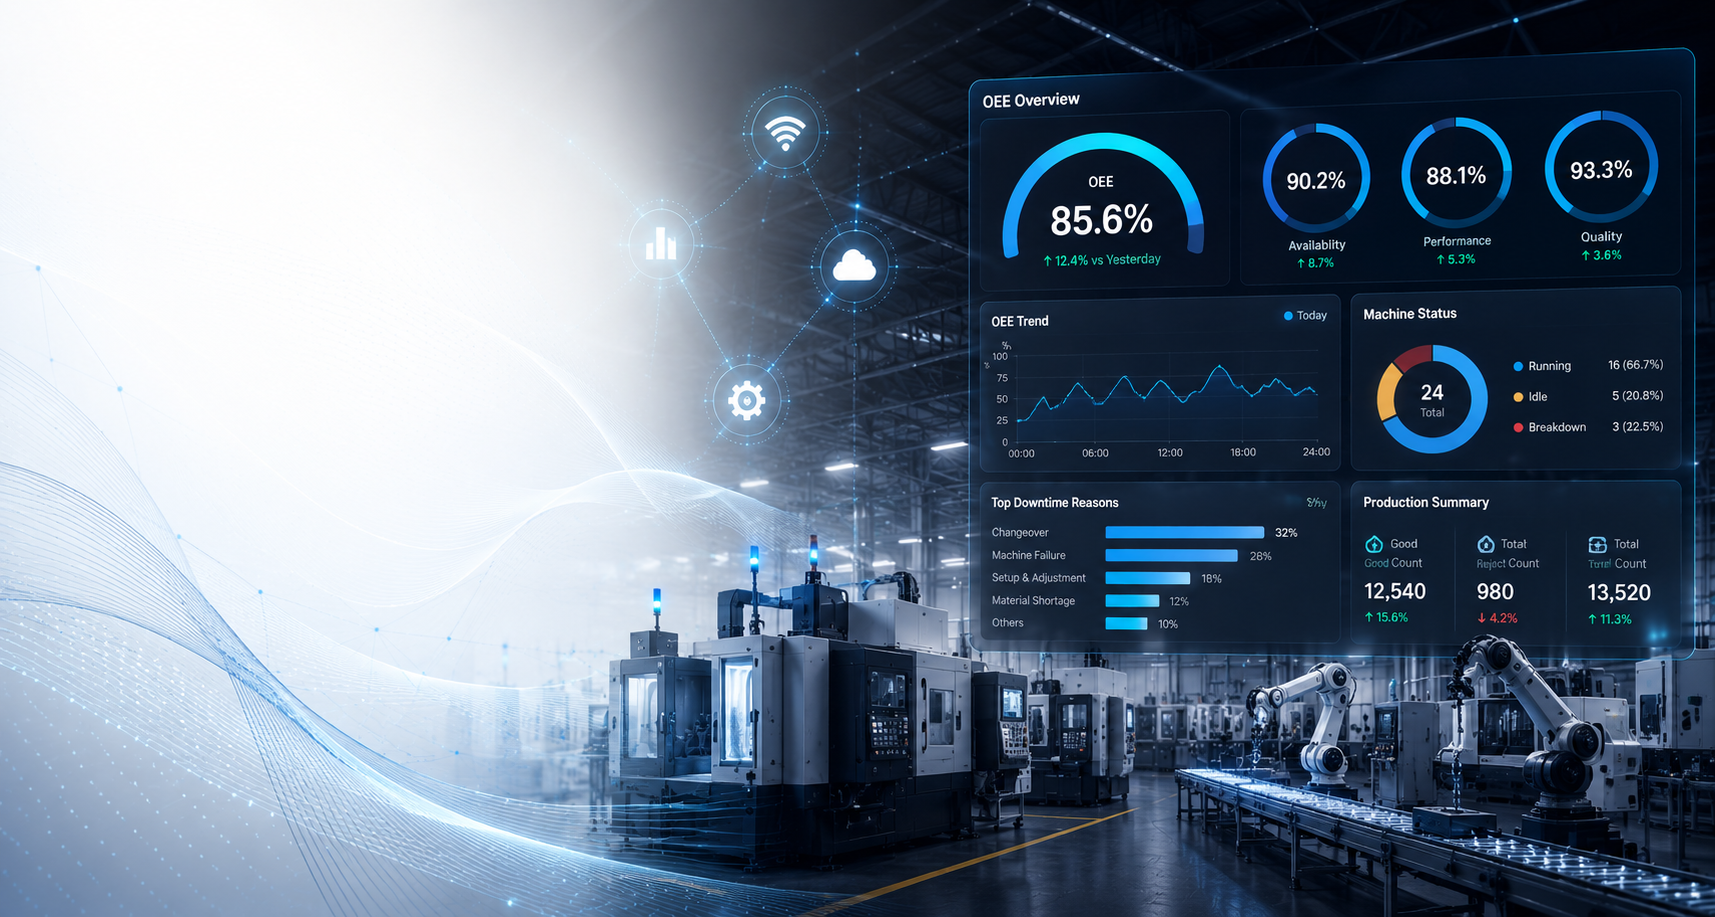
Overview

Transform Plant-Floor Intelligence

Most manufacturing organizations struggle with fragmented data sources, reactive problem-solving, and limited visibility into real-time equipment performance. Production losses due to downtime, quality issues, and performance variations often go unnoticed until they impact bottom-line results.

OEE Monitoring is an advanced Industrial IoT platform that delivers real-time visibility into machine performance, automatically captures downtime events, calculates OEE metrics in real-time, and provides actionable insights to drive operational excellence across your manufacturing facilities.

Every metric is guaranteed to be

  • Real-TimeLive data with <1 minute latency
  • 🎯
    AccuratePrecise OEE calculation engine
  • 📍
    TraceableEvery event logged with timestamps
  • 🔒
    SecureEnterprise-grade encryption & access control
  • 📈
    ActionableInstant alerts on anomalies detected
  • 📊
    ComprehensiveComplete audit trail and trend history

The Problem

Manufacturing Pain Points

Organizations without real-time equipment monitoring commonly face these operational challenges:

🔴
Blind Spots
Limited visibility into real-time machine status, making it difficult to respond to downtime incidents quickly.
📉
Poor Planning
Lack of accurate OEE metrics prevents effective capacity planning and production scheduling.
⚠️
Manual Tracking
Data captured manually through spreadsheets is error-prone and time-consuming to analyze.
🔍
Root Cause Blind
Without automated downtime capture, identifying root causes for production losses becomes nearly impossible.
💰
Hidden Losses
Performance and quality losses go unnoticed, resulting in significant operational cost leakage.
⏱️
Delayed Insights
Lag between data collection and analysis prevents timely decision-making on the production floor.

Impact

Measurable Business Benefits

Real-world results from organizations implementing OEE Monitoring.

10-30%
Increase in Equipment Utilization
40-60%
Reduction in Unplanned Downtime
25-40%
Improvement in Production Visibility
50%
Faster Root Cause Identification

Features

Core Capabilities

Everything needed to monitor, analyze, and optimize machine performance.

Core — IncludedAdd-on — Optional
📡Core
Real-Time Machine Monitoring
Live tracking of machine status (Running, Idle, Breakdown) with seamless PLC, sensor, and SCADA integration.
⚙️Core
OEE Calculation Engine
Automatic OEE calculation based on Availability, Performance, and Quality metrics with accuracy validation.
🚨Core
Downtime Analysis
Instant downtime detection with automated root cause categorization and manual reason capture capabilities.
📊Core
Multi-Level Dashboards
Machine-wise, line-wise, and plant-wide dashboards with visual KPIs for quick decision-making at all levels.
📈Core
Production Tracking
Production count monitoring (Good/Reject), cycle time analysis, and shift-wise, batch-wise detailed reports.
🔔Core
Smart Alerts & Notifications
Instant alerts for machine breakdowns with threshold-based notifications via Email and SMS integration.
📋Add-on
Digital Checklist Integration
Operator checklist digitization with compliance tracking and audit-ready logs linked to OEE data.
🧠Core
Trend Analysis & Insights
Historical data analysis, custom reports (Shift/Day/Week/Month), and export to Excel/PDF formats.

Architecture

Solution Architecture

A scalable IoT architecture from edge data collection to enterprise visualization.

01
Edge/IoT Layer
IoT Gateway
Industrial PC
PLC/Sensor Interfaces
Data Acquisition
02
Connectivity Layer
OPC-UA
Modbus
MQTT
REST APIs
03
Application Services
OEE Calculation
Downtime Detection
Alert Service
Report Generation
User Management
04
Data & Storage Layer
Time-Series Database
Historical Data
Cache Layer
Search Index
05
Visualization & BI
Real-Time Dashboards
Trend Analysis
Custom Reports
Mobile Access

Deployment Options

On-Premise Deployment
Cloud-Based (Public/Private)
Hybrid Architecture
Multi-Plant Scalability
Zero-Downtime Updates
Disaster Recovery

Enterprise Features

Real-time data sync
Machine learning alerts
Role-based access
Audit logging
Data encryption (SSL/TLS)
High availability setup

Integrations

External Integrations

OEE Monitoring connects seamlessly with your existing manufacturing ecosystem.

🤖
PLC & Automation
Siemens, Allen-Bradley, Schneider Electric, and legacy systems
📊
SCADA & HMI
Real-time data acquisition from control systems
🔗
ERP Integration
SAP, Oracle, and custom production planning systems
📲
IoT Platforms
AWS IoT, Azure IoT, and custom MQTT brokers

FAQ

Frequently Asked Questions

Common questions from manufacturing leaders evaluating OEE Monitoring.

Ready to optimize equipment performance?

Talk to our team for a personalized demonstration tailored to your manufacturing facility. We'll show you real-time OEE calculation, downtime analysis, and dashboard customization.